Lab: Energy Conservation Lab
Partners: Mikey Haydt
Date: January 14, 2015
Partners: Mikey Haydt
Date: January 14, 2015
Energy Conservation Lab
In this lab, I am to find the predicted velocity of a cart pushed by a spring using constants I find and setting up an energy conservation problem. After this, I am to compare the derived velocity to an actual velocity measured using the photogates in Datastudio.
Part I: Finding k
|
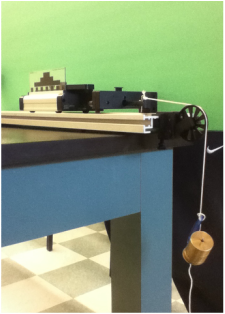
In order to begin the experiment in Part 2, I had to find the spring constant k.
Simple put, k is a mathematical constant showing the strength of a spring. To find this, I had to use the equation of F = kx, which was rearranged to k = F/x in order to find the spring constant. Using this, I set up the lab setup shown on the right. In this setup, I placed weights of set differences in mass along a pulley parallel to the cart. Having the set masses, I measured the displacement (x) of the cart at each point, giving me the parts of the equation needed for finding k. |
|
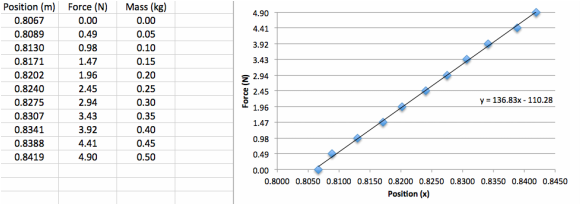
Above-left: documented forces and positions per mass
Above-right: graph of force/position (k = slope) |
Now having the positions with their respective forces, I am now able to graph the results. With the equation being k = F/x, I can find k simply by finding the slope of the line on the graph. This graph can be seen to the left. For my results, I find that k = 136.83 N/m.
|
Part II: Predicting the Velocity
Now having k, I am now able to solve for v in the equation. Knowing that the elastic energy from the spring is equal to the total kinetic energy of the cart upon release. I am able to set the equations for each to each other and solve for v,To make matters shorter, you can see the work to get the equation below.
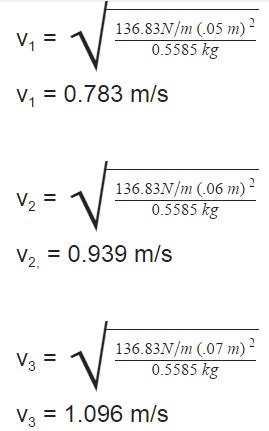
For this particular experiment, I used a position (x) of 7 cm (.07 m) for the spring & cart, while also using an x of 6 cm & 5 cm to check the validity of the results. And for these equations, where k is a constant of 136.83 N/m and m = 0.5585 kg, I got the following results:
v1 = 0.783 m/s v2 = 0.939 m/s v3 = 1.096 m/s
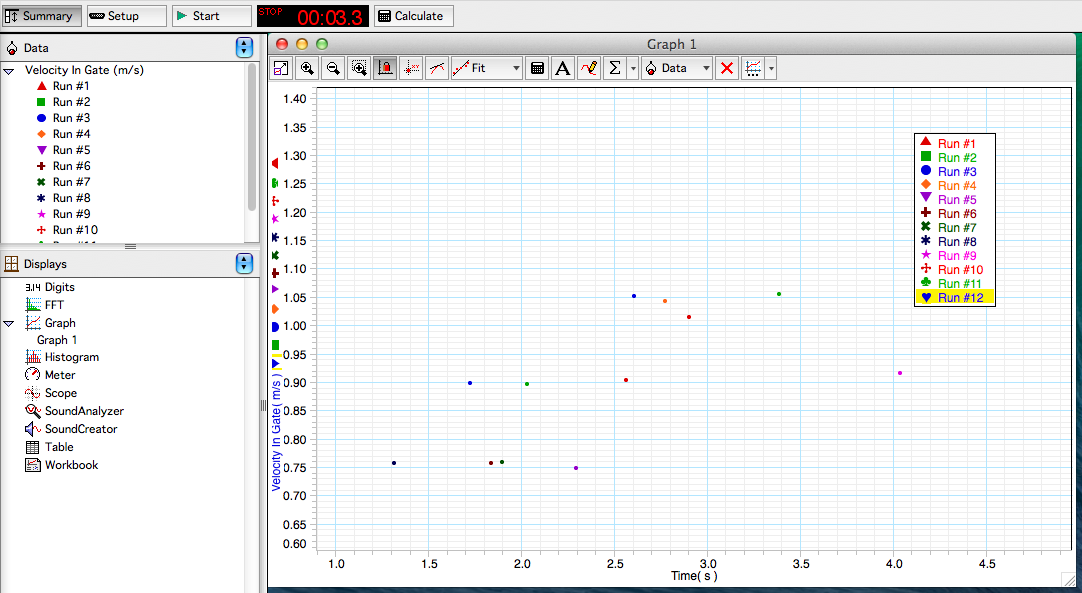
Now that I have the experimental results, I can now compare them to the actual results, which I measured using a photogate to measure the velocity of a 2.5-cm-long flag length. The measured velocities are as follows:
v1 = 0.76 m/s v2 = 0.91 m/s v3 = 1.06 m/s
For this particular experiment, I used a position (x) of 7 cm (.07 m) for the spring & cart, while also using an x of 6 cm & 5 cm to check the validity of the results. And for these equations, where k is a constant of 136.83 N/m and m = 0.5585 kg, I got the following results:
v1 = 0.783 m/s v2 = 0.939 m/s v3 = 1.096 m/s
Now that I have the experimental results, I can now compare them to the actual results, which I measured using a photogate to measure the velocity of a 2.5-cm-long flag length. The measured velocities are as follows:
v1 = 0.76 m/s v2 = 0.91 m/s v3 = 1.06 m/s
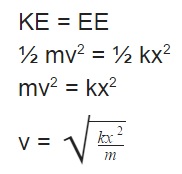
Top-Left: Equations for finding v and equation for %-diff
Right: Results for experimental velocities Bottom: Results for measured velocities using DataStudio |
|
Accuracy & Conclusion
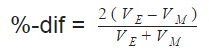
Finally, all that must be done now is to find the %-diff of the various velocities. Going through the process of finding the %-dif for each individual pairing of velocities, I find this:
%-diff (v1) = 2.981% %-diff (v2) = 3.137 % %-diff (v3) = 3.34%
Seeing as the inaccuracy is around a constant 3%, I can firmly say that the experiment was a success. Though the small inaccuracies would be caused by factors of energy being lost due to friction and by variants in the measurements, the experiment went through as planned. All-around, the experiment showed that the Laws of Conservation hold true, along with showing the relations between different forms of energy.
