The Experiment
|
In this experiment, my two lab partners (Dakota Smith and Bruce [can't remember last name]) and I took measurements of the position of a rolling cart on a ramp, each at varying slopes. We hoped to use this acquire this knowledge via different methods and use it to calculate velocity and acceleration from the data, along with the forces that act upon the cart in the process.
|
|
Theory
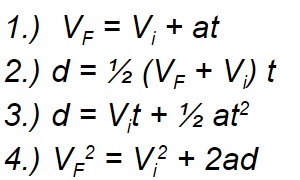
Given the information of what to do prior to the lab, each lab member in the group chose a different slope of ramp to base their data off of, though the process of how it was done remained the same. The four basic equations [seen above] were used along with individual work using hand tools, a ticker tape time, and programs such as Photobooth and Microsoft Excel. By common judgement, the acceleration should stay constant, due to gravity having a constant acceleration of -9.8 m/s². We will only know after the lab is fully conducted.
Experimental Technique
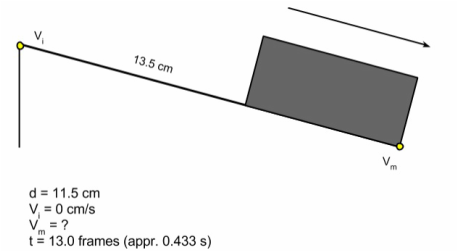
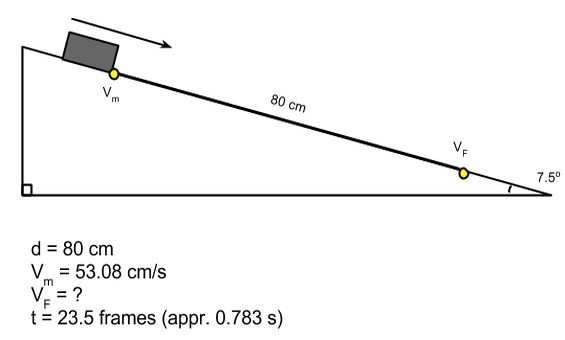
Given a ramp and cart, along with the fact that there must be a non-zero starting acceleration, the experiment was set out. The ramp was marked with tape for starting and stopping points, along with a set distance of 80 cm from start to stop, and an approximate angle of 7.5° for the ramp. Not knowing enough data, a smaller-sided graph was created w/ parts and labels in order to final the information for the larger-sided graph (See drawings below for steps).
|
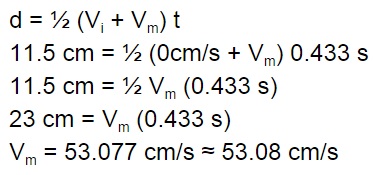
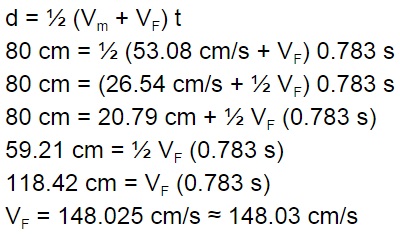
(Used Equation #2 listed above in order to solve for mid-velocity on small-sided graph [to left] for the large-sided graph [down below])
|
|
|
In order to acquire such numerical values for the mathematical part of the process, distances were marked and measured via ruler on the ramp; time calculated by freeze-frame measurements in Photobooth [videos to side] at 30 frames per second.
Now, for the real part of the experiment.
Using a ticker-take timer, measurements were taken on a marked paper strip that was set in correlation to the 80 cm distance between the points of mid-velocity and final velocity. After that was finished, distances from the beginning segment of strip were taken for each individual point, allowing a table to be set for point-to-distance relation, or the position at an individual time. Note, the ticker-tape timer has a period of 40 ticks per second. From that point on, knowing that the average velocity is difference of two consecutive positions divided by the difference of their paired times allows knowledge of velocity at each (or rather, inbetween) the points. Additionally, the same is for average acceleration at each point, where the differences in velocities divided by the difference in appropriate times gives the right answer. Afterwards, graphs were made from the tables of data, which can be seen in the file here.
Analysis
Judging by the way the lab has went, some results of the data were predictable while others...not so much. Though position and velocity were rather simplistic and expected in their data structure (an upwards-curving line & slower-curving upwards line, respectively), the data for acceleration presented itself in a rather random formatting. Lacking any clear correlation whatsoever, the acceleration appeared to be anywhere at any given time on the chart, though it tended to stay positive, completely destroying the previous hypothesis. Though not certain, such data could be caused from friction between the cart, ramp, and air, along with any unintended mishap movements due to such things as the ramp moving (even slightly) or the efficiency of the cart moving down the ramp. However, it was most likely due to the frictional components along with any possible error due to compiled measurements or the ticker-tape timer. Whatever the reason, the previous hypothesis is busted.
Conclusion
This experiment was intended to study and calculate the acceleration of a cart moving down an inclined plane based off of the use of equations, mathematics, tools, and any other available resources. Using equations (Equation #2 to be precise), the specific components of the cart movement were discovered, while the measurements were based off of tools such as rulers, freeze-frames, and ticker-tape timers, to name a few. Finally, the data was laid out and planned out on multiple graphs, where position, velocity, and acceleration at individual points were calculated using prior-found measurements. In the end, the acceleration was found to fluctuate violently, though tending to stay positive. This was most likely caused due to friction between the air and multiple experimental components, and any error caused by reactions and the ticker-tape timer.
